G Systems was tasked with automating the processes of calibrating pressure transducers for flight test, performing results analysis, and adding the results to a database.
G Systems was tasked with automating the processes of calibrating pressure transducers for flight test, performing results analysis, and adding the results to a database.
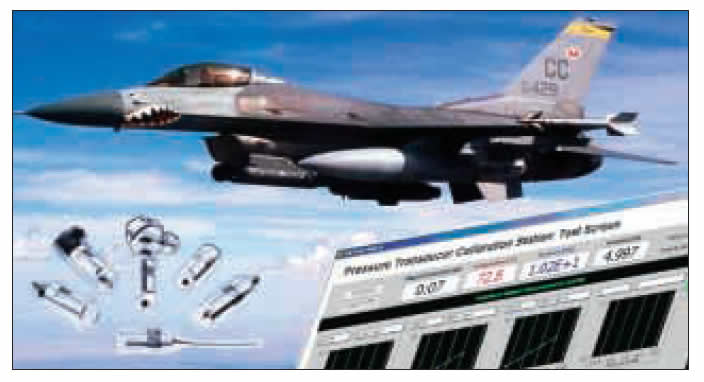
The Flight Test Instrumentation (FTI) group and Calibration Laboratory of Lockheed Martin Aeronautics Company in Fort Worth, Texas certify transducers for use on test aircraft such as the F-16 fighter. The Calibration Laboratory calibrates transducers and verifies that they operate within tolerances specified by the FTI Group. The success of in-flight measurements depends highly on the reliability and accuracy of the transducers tested by the Calibration Laboratory.
G Systems was asked to automate the processes of calibrating pressure transducers for flight test, performing results analysis, and adding the results to a database.

Develop LabVIEW applications for performing calibrations and managing resultant data files (Figure 1a).
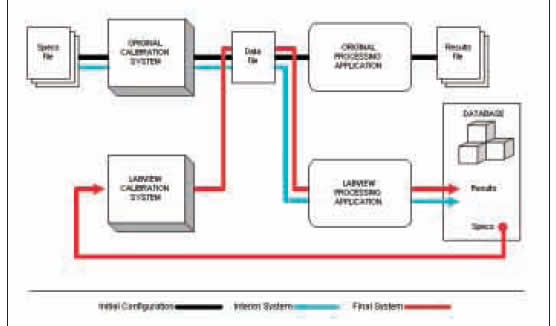
Initially, the project began with a new database developed to manage administrative as well as technical information for the FTI group. The database provided a reliable way to store the manufacturer specifications and actual calibration results for the many types of transducers handled. G Systems’ first task was to process raw calibration data files and place the results in the database. The second task, a year later, was to automate their new Pressure Transducer Calibration Station (PTCS) and generate the same format data files in order to integrate with the existing systems. By keeping the original format of the data file, it was possible to convert to the new system in two stages with no interruption of the workflow. Refer to Figure 2 to see how the system evolved over time.
One of the goals of implementing a database to hold transducer specifications and results was to centralize the data storage and provide access to the latest results from anywhere in the company. Along the same line of reasoning, a single server was devoted to processing raw data files and placing the results in the database. A specific folder on this server is shared with all users who generate calibration data files. After a technician generates a data file, he copies it into the shared folder and the processing application (known as TransCalc) automatically detects it, processes it, and inserts the results into the database.
Once the TransCalc application detects a new file, it reads a standard header and determines what type of transducer was tested and the format of the data. Every type of transducer produces a different set of data and needs to be processed differently. The dynamic loading capability of LabVIEW’s VI Server was used to accommodate future integration of new transducer types.
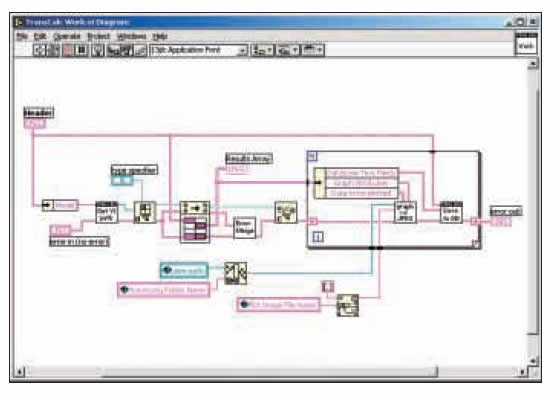
We created one data processing VI per transducer type and the TransCalc application loads the correct VI as specified in the data file header. When a new transducer type is added, no changes need to be made to the main application. You only need to create a new VI to perform the processing. Figure 3 illustrates the architecture used to accomplish this task. You will also notice that the application generates a JPEG image as part of the processing. The image contains a graph of calibration results (like the one shown in Figure 5) and is embedded directly into a database record for later analysis.
The next stage of the project was to automate the calibration of pressure transducers. While, the TransCalc application developed in the first phase was capable of processing many types of transducer data, this new application focused on only pressure transducers. As time goes on, test stations for other transducers such as accelerometers and vanes and may also be automated. The results files from these calibrations are sent to the server and processed by the TransCalc application.
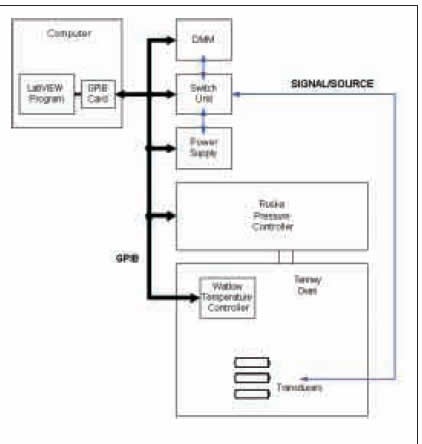
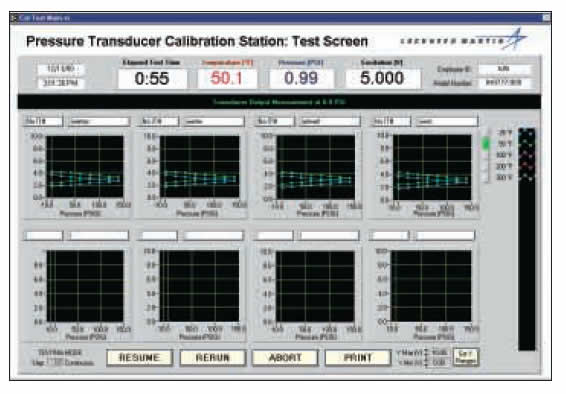
The software for the new PTCS needed to control the pressure and temperature in an environmental chamber across the full range of operation specified by the manufacturer. At each set point, the system must record the transducers output signal as well as measured values of pressure, temperature, and excitation voltage. (The earlier system did not measure the pressure independently of the set point). The customer supplied the new pressure controller and environmental chamber and G Systems built the instrumentation rack and associated cabling. The system communication scheme is shown graphically in Figure 4.
Pressure is varied over the acceptable input range of the transducer. It begins at the minimum pressure, and moves up to the maximum and back to the minimum again so that hysteresis can be measured along with non-linearity. After a complete pressure cycle, the temperature is set to a new value. After the temperature has stabilized, the pressure cycle is repeated. The pressure cycle is performed at each temperature to verify the transducer output remains within tolerance as temperature varies. A transducer is judged to pass or fail according to the manufacturer’s specification of deviation from true linear output as a function of input pressure. A typical specification might be < 0.1% of the full-scale output over the entire pressure and temperature range. By finding the best-fit straight line and measuring deviation, the application can determine pass/fail status. As shown in Figure 5., the deviation usually follows a rounded curve due to mechanical characteristics of the transducer diaphragm. The transducer measured in this case failed due to the large hysteresis at high temperature.

As a result of automating the pressure and temperature control using LabVIEW, the time to calibrate a single transducer at multiple temperatures was reduced from about 24 hours to about 10 hours. The application retrieves testing specifications directly from a database and puts the results back into it. The technician’s work is greatly reduced since paperwork is minimized and pressures/temperatures no longer need to be dialed in manually. In addition, opportunities for data entry errors were virtually eliminated since the software will only allow the calibration of transducers already existing in the database and all setup information is automatically retrieved from the database.
Products Used:
LabVIEW
SQL Toolkit™
PCI-GPIB Controller Board
Bookkeeping, manual labor, and test time were all reduced as a result of these new applications. Using the versatility of LabVIEW and associated add-ons, a complex system for calibrating transducers, analyzing measurement data, and storing results was simplified into a single, unified system. Test time was reduced in some cases by more than 50%, and overhead reduced similarly. The power of LabVIEW made a complex task easier, and leaves a reliable, and highly maintainable system for its users.
The best way to begin is by having a conversation with a member of the G Systems teams about your test challenges and the options for helping you solve them.
Based near Dallas, Texas, G Systems is an internationally recognized systems integrator specializing in the modernization of complex systems of all sizes. We are experienced in the design, integration, assembly, production, and maintenance of custom turnkey solutions that support our customers at all phases of their product’s maturity cycle.
NAICS Codes: 541330, 541715, 541511, 334515, 335999, 334519
CAGE Code: 3HPP5
![]()