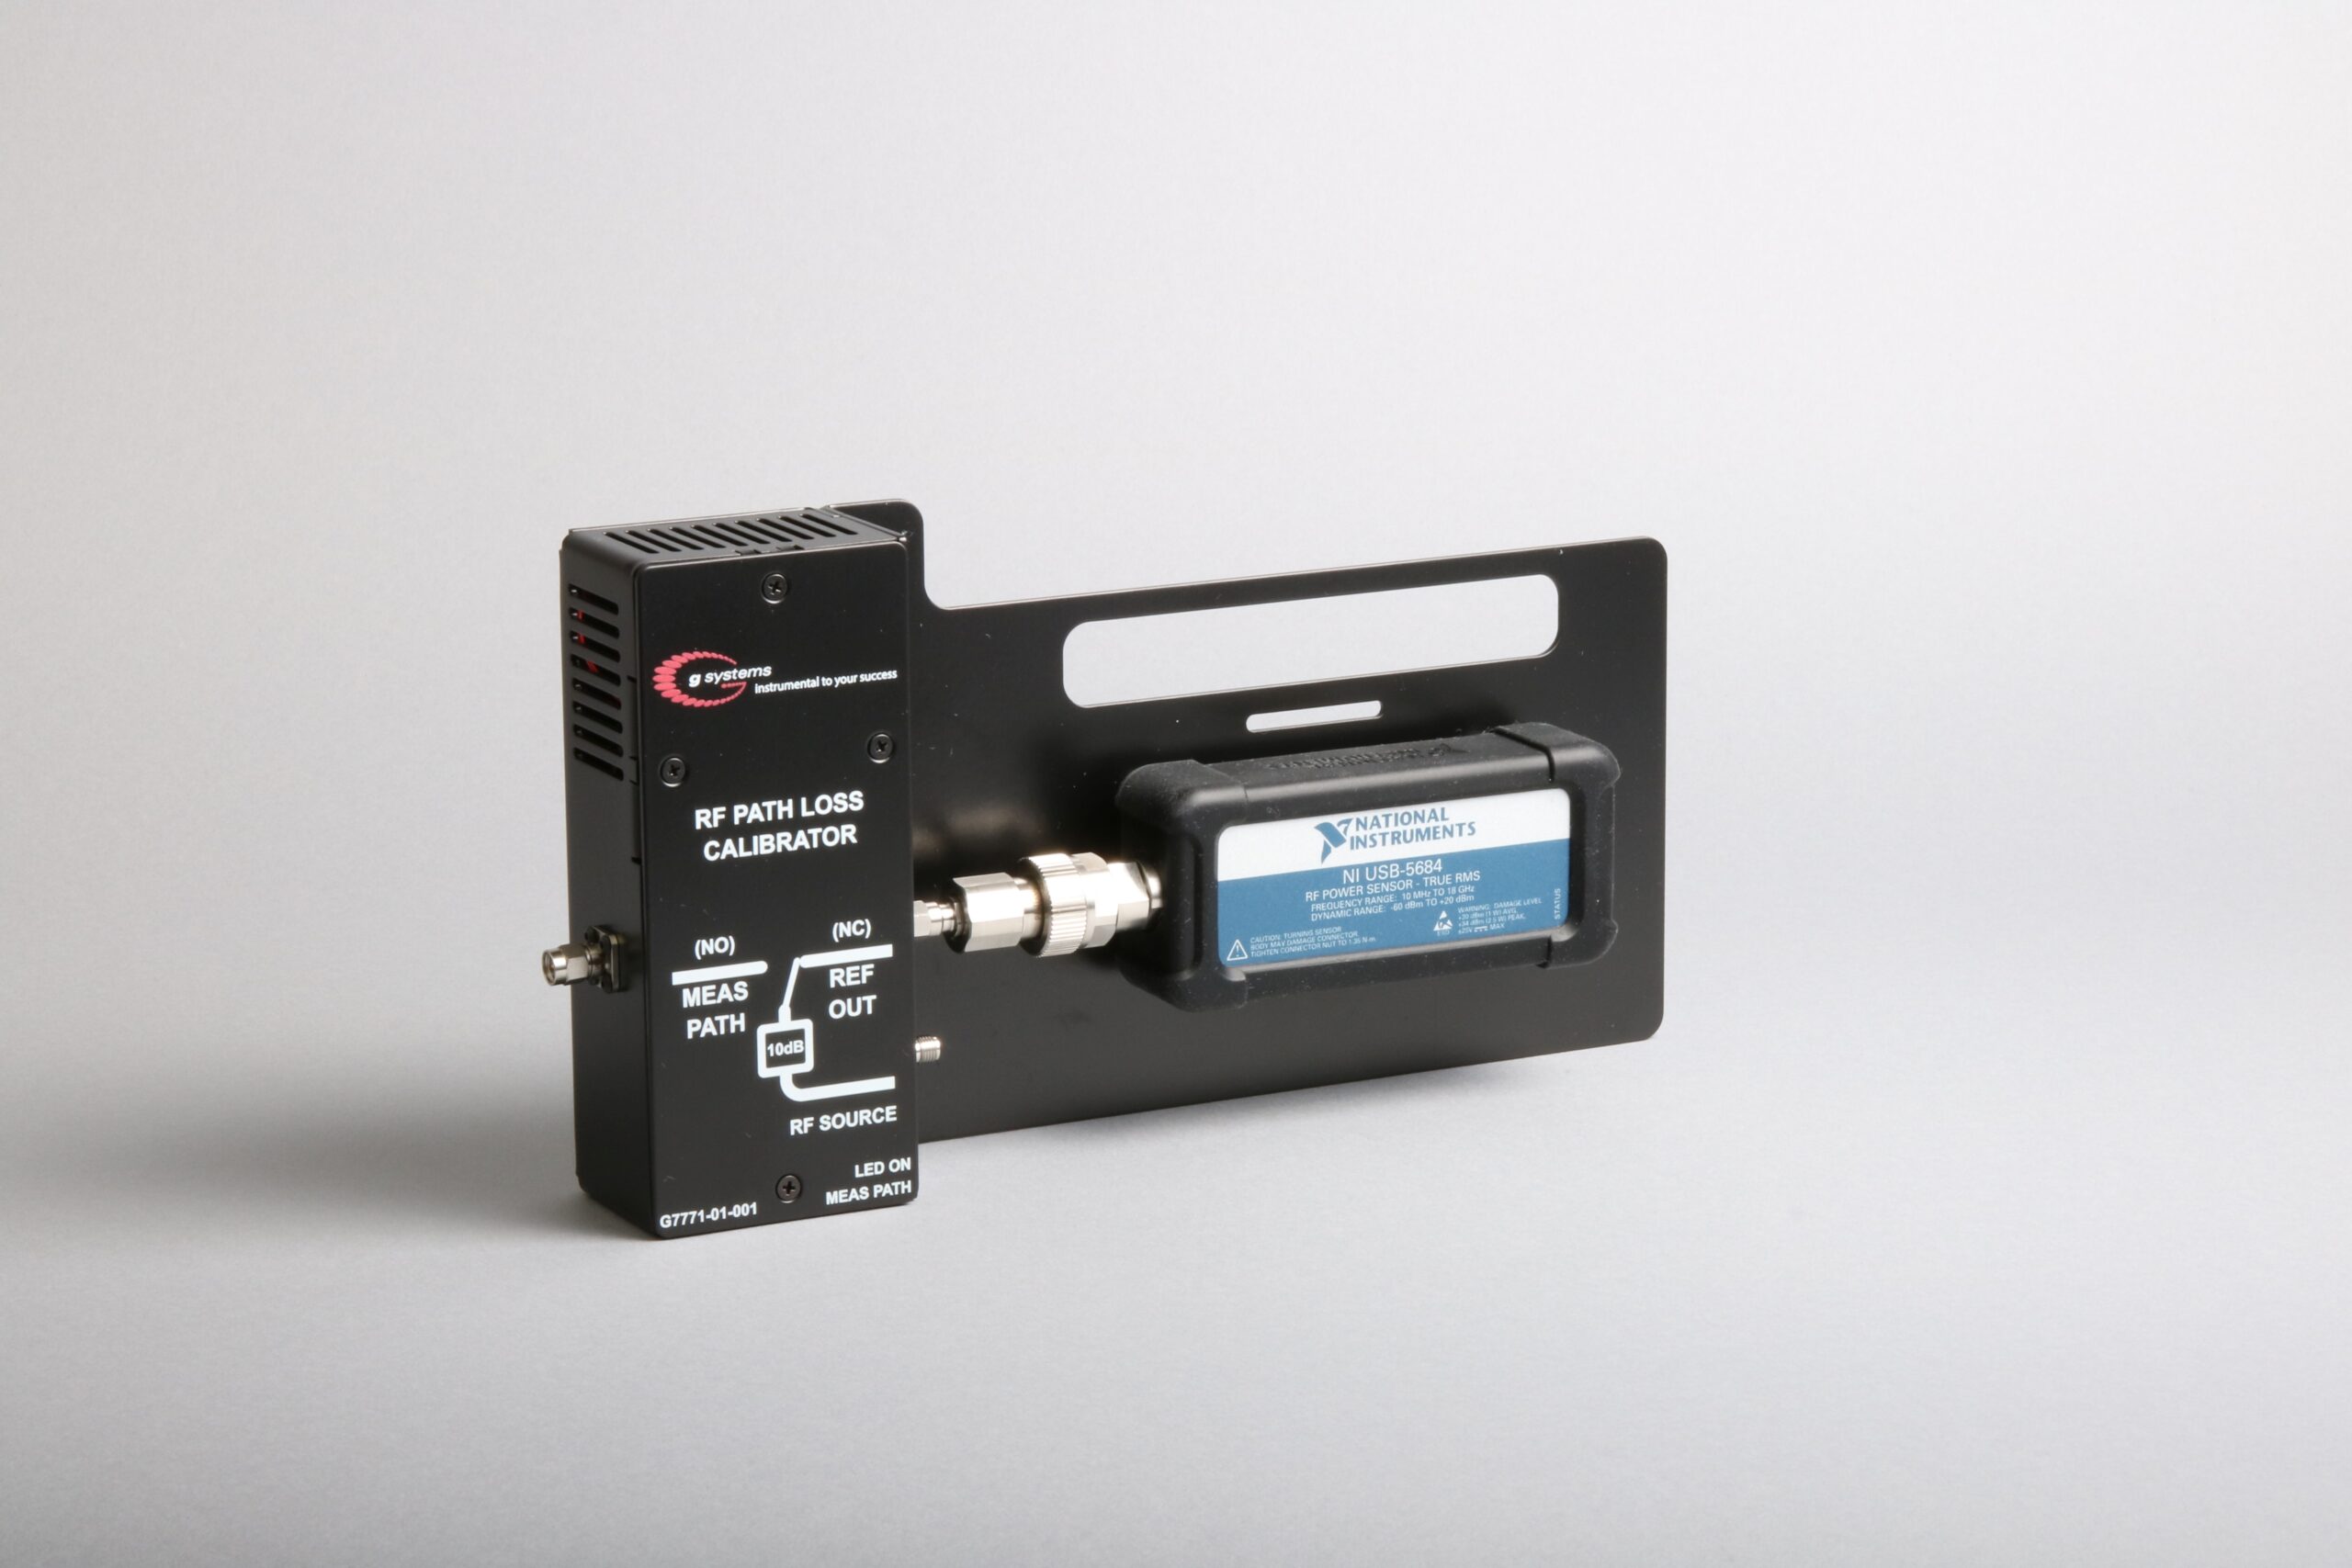
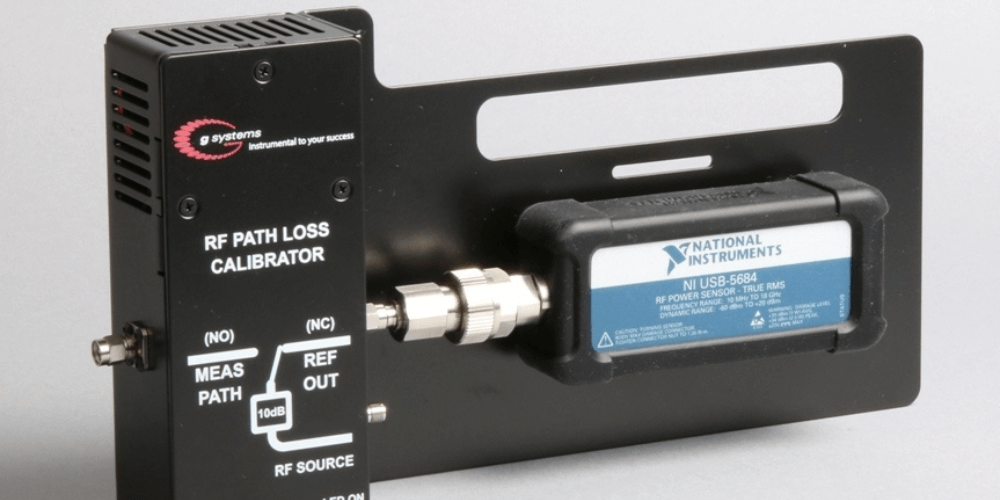
What is the G Systems RF Path Loss Calibrator and how can it help your business? Improved accuracy, convenience and long-term cost savings are some advantages. Others include saving time as well as cable wear. The greatest savings stack up when you factor in labor costs. The RF Path Loss Calibrator helps alleviate the often error prone and tedious task of calibrating RF cabling.
Let’s take a closer look.

Relative RF power measurements should be used everywhere possible. Frequently however, you need to make an absolute power reading when dealing with RF test systems. In order to make absolute RF measurements at some point other than your measurement instruments reference plane, you need to know the loss of all equipment (cabling, attenuators, adapters, etc.) between your measurement point and the measurement instrument. This conundrum is illustrated in Figure 1.

As can be seen in Figure 1, there can be a plethora of frequency dependent devices between your measurement test port and the measurement instrument (in Figure 1, a National Instruments Vector Signal Analyzer). The traditional approach to finding the loss is a three-step process.
Step 1 – Establishing a reference power at a cable end port. This requires the use of a stable signal generator, an RF cable, an attenuator (10dB works great), and an RF power meter. The cable is connected to the RF signal generator with the attenuator at the opposite end. The power meter is then connected to the attenuator. The signal generator is set to give a healthy signal at the frequency of interest. Each frequency point is measured with the power meter carefully with averaging to establish the frequency vs. power at the attenuator end of the cable. Each power meter measurement is recorded.
Step 2 – Apply reference power to test port and measurement with instrument. Disconnect the power meter from the attenuator end of the cable and connect the same to your test port. Repeat the same frequency points with the signal generator at the same power level. Record each measurement instrument reading.
Step 3 – Subtract the measurement instrument reading from the reference readings. Take each of the same frequency points from step 2 and subtract the recorded value from step 1. This array of results gives you the loss vs. frequency of your test port. You can then offset the readings from the measurement instrument by the value of this loss array to get absolute power readings.
As a side note: You don’t always have to have a corresponding frequency in your loss table for each frequency you want to measure with your VSA. Values of loss can be interpolated between frequencies if necessary. Just remember if your values of loss are stored in dB or not so that your interpolations can be logarithmic or linear. Interpolating allows you to NOT have to record every frequency you might ever want to use for future corrections.
The astute RF engineer will note that we have performed a relative measurement by first using the power meter and then the measurement instrument (VSA). Also, the RF engineer will see some possible weakness in this technique. Did the signal generator keep the same power for both measurements? Make sure your RF signal generator is properly warmed up before proceeding to maximize repeatability from the signal generator. When the power meter was removed and the cable connected to the test port, did the cable keep the same insertion loss? All RF cables change a bit when flexed. Really high dollar cables move a lot less than budget cables. The stability of the cable depends on your level of accuracy required and how much money you plan to spend. Did you add any RF adapters when you made the connection to your test port? The loss of your adapter needs to be known if you want the best accuracy.
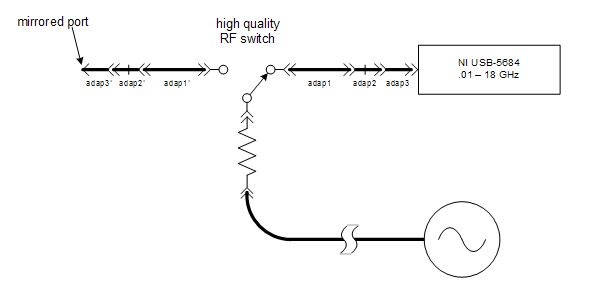
G Systems’ RF Path Loss Calibrator is designed upon the same principles and steps as given above. See Figure 2 for a diagram of our Calibrator.

The design magic happens by utilizing a high-quality RF switch to mirror the reference path to the measurement port and to keep each of these two paths equivalent in loss.
If I were to write down the loss equation for the measurement shown in Figure 2, it might look something like this:

Equation 1 – Reference Path Power (dB)
This equation assumes loss vs. frequency functions are given in dB. Thus the plus signs instead of multiplication!
Now, if I were to switch the RF switch to the other position, connect to my measurement port, I could write a new equation:

Equation 2 – Measurement Power (dB)
The last step involves subtracting the Reference path readings from the Measurement path readings to get the Path Loss as follows:

Equation 3 – Measurement Power minus Reference Power
You can see immediately the SignalGenerator(f) is irrelevant if the signal generator was exactly the same for both measurements. The same could be said for the Cable(f) and the Atten10dB(f). If you don’t move the cable between measurements, keep your power low enough so as not to make the readings change from overheating, both the cable and any attenuator are irrelevant.
That leaves the adapters. My assumption is that the adapters although not perfect, are very similar.
Finally, using this last assumption leaves us with Equation 4:

Equation 4 – Path Loss vs. Frequency
This shows that the Path Loss is equal to the Measurement Instrument readings minus the Reference Power readings.
Let’s review these assumptions:
- The signal generator reproduces its power identically at the same frequencies.
- The cable has not moved or heated up or changed in any way so as to change its loss.
- The attenuator has not heated up or changed in any way so as to changes its loss.
- Adapter1(f) = Adapter1’(f) .
- Adapter2(f) = Adapter2’(f) .
- Adapter3(f) = Adapter3’(f) .
- Components constituting path loss are not changing.
These are a lot of assumptions for you to take on faith. Let’s look at some real data. In Figure 3 below, I show a reference power reading with the power meter connected to its reference port.

I took several closely spaced readings below 1 GHz and proceeded to 18 GHz, the upper limit of the USB-6584 power meter. You can see that the power falls off in a gradual manner until the reading at 13 GHz. I think this is where the signal generator changed ranges internally. There is another discontinuity on the 17 GHz reading. This is not a problem if you recall assumption #1. As long as the signal generator is repeatable between runs, any inaccuracies do not matter.
Next, I removed the power meter, connected it to the measurement port on my RF Path Loss Calibrator, and switch the internal relay. Again, I ran thru the same set of frequencies at the same power level and took readings. The results are illustrated in Figure 4. If my assumptions were valid, that the paths about the switch were equal, the plot in Figure 4 would be identical to the plot in Figure 3 (the reference power). They are not equal.

Figure 5 shows the results of subtracting the measurement port power plot from the reference port power plot. I call this the Mirror Quality Graph. This is an indication of how well the calibrator mirrors the power delivered to the measurement port of your test set. The quality of mirroring is affected by the assumptions I listed earlier. You can see from Figure 5 that the largest error in mirroring is around 11 GHz at -0.033 dB. Very tight indeed! Converting to linear units and percent, this gives us a mirror quality of 0.76%.

This mirror quality is perfectly adequate for many test applications. The largest deviation from perfect is at 11 GHz with most frequencies about twice as good. What this means, practically speaking, is that your path loss can be accurately estimated with better that 1% error. Of course this brash statement ignores any errors in the reference power meter and the measurement instrument. You are stuck with those errors anyway and can be treated with alternate techniques.
Why should you invest in an RF Path Loss Calibrator? Accuracy and convenience and long-term cost. A really good RF cable which minimizes flex loss changes will cost almost as much as our RF Path Loss Calibrator. With our RF Path Loss Calibrator, you only make one RF connection to your test port. Our Calibrator comes with a connector saver as the test port connector. When it wears out, you simply replace it with another high-quality adapter. The traditional approach tends to wear out your expensive RF cable thru mating/unmating cycles long before our less expensive cable gives up.
But the real savings come when you examine the labor aspect. The traditional approach requires two (2) RF connections; one to the power meter and one to your test port. G Systems’ Calibrator requires only one connection to the test port. With only one RF connection, you save time and cable wear. The calibration application that G Systems uses also expedites the calibration process by using a customized, yet self-contained VI which speeds up repetitive calibration considerably.
Part II of this RF Path Loss Calibrator blog will discuss the development of the USB controlled relay and the user customizable code base that is provided as an example to the end user.
If you’d like to know more about this product, including how to procure our RF Path Loss Calibrator for your use, contact us.
G Systems can benefit your business multiple ways in the area of RF component test. Learn more about improving the quality of your RF measurements by downloading this white paper: Five Best Practices for Quality RF ATE Measurements.


